Burning Tokens Is Not Shipping
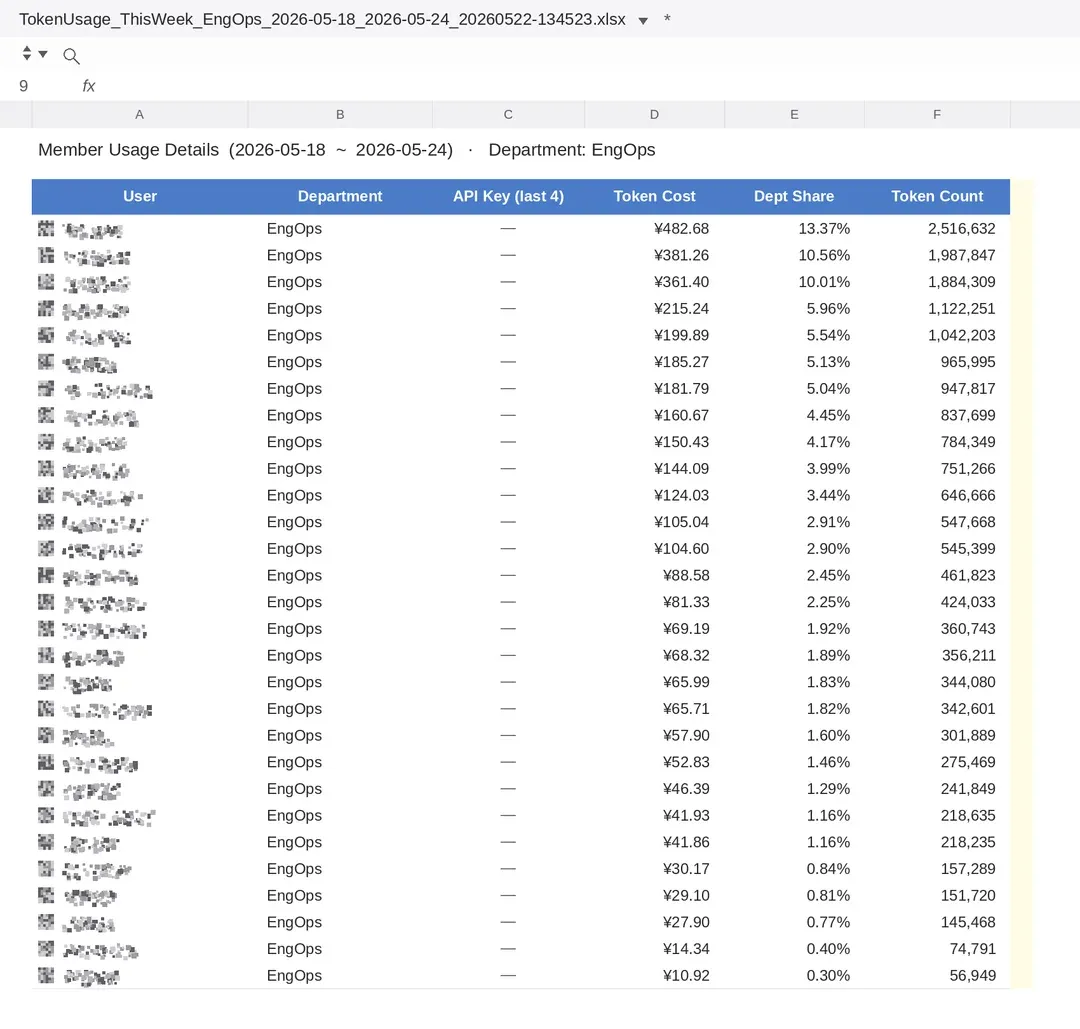
Read that twice. The leaderboard is the product.
This is not a niche quirk. It is the cleanest case study we have seen this year of a pattern killing engineering metrics across the industry. When output is hard to measure, leaders measure activity. When activity is hard to measure, leaders measure spend.
In the AI-coding era, spend looks exactly like progress. Until someone opens the codebase six months later and finds nothing was built.
What the leaderboard actually measures
A token leaderboard captures who left Claude Code running overnight on a polling loop. Who asked the agent to refactor the same module 47 times instead of merging the first acceptable version. Who used Ultrathink for a one-line change because it sounded thorough. Who set up six parallel sessions and walked off for lunch.
It does not capture who shipped a feature. Who fixed a customer-facing bug. Who reviewed the agent's output and caught the SQL injection before it hit production.
One developer wrote a dev.to post about consuming $50,000 worth of Claude Code tokens on a $200 plan in one month. He called himself the number-one token consumer worldwide. Anthropic's own docs put the average developer at around $6 per day, or $100 to $200 per month. He used 250 times the average.
Did he ship 250 times more? The post does not say. It does not have to say. The framing was never about shipping. It was about consuming.
This is the engineering equivalent of measuring a writer by their daily word count without ever reading what they wrote.
Why leaders default to this
The leaders who set up these leaderboards are not malicious. They are stuck.
Engineering management in 2026 is harder than it was in 2022. The traditional output proxies are dying. Lines of code is laughable when an agent writes 4,000 lines while you sleep. Pull requests merged is gameable when you ask the agent to split one feature into eight micro-PRs. Velocity points stopped meaning anything the moment estimation became guess the agent output.
A manager looking at their team in 2026 has fewer signals than ever before. And more pressure than ever before to prove the expensive AI investment is paying off.
So they reach for the metric that is loud, automated, and looks plausibly correlated with productivity. Token spend. Easy to track. Easy to compare. Easy to put on a dashboard for the CFO.
Token spend is correlated with productivity in the same way gym attendance is correlated with fitness. It works until people figure out it is being measured. Then it stops working immediately.
The Goodhart spiral, AI edition
Goodhart's law is older than software. When a measure becomes a target, it stops being a good measure. The token leaderboard is the latest case. It will play out faster than usual, because the gaming is trivially automatable.
Here is what happens in the org with the leaderboard, on a six-week timeline.
Week 1. Engineers genuinely use Claude Code more, because they want on the leaderboard. Token consumption climbs. Manager celebrates the engagement metric.
Week 3. The savviest engineer sets up a background task that runs analysis loops on the codebase overnight, consuming tokens with no human in the loop. He tops the leaderboard. Manager celebrates automation adoption.
Week 5. The behavior spreads. Most of the team has some flavor of autonomous token consumption running in the background. Real engineering happens on the side, when humans get to it. Leaderboard numbers are at all-time highs.
Week 7. A customer complaint reveals the feature that was supposed to ship in week 4 still has not shipped. Delivery velocity is lower than before Claude Code arrived. The team's attention is split between real work and leaderboard farming. Manager is confused. Dashboard is green.
Week 8. The leaderboard quietly comes down. No retrospective.
We have seen variants of this in three client engagements over the last twelve months. The metric changes. The dynamic is identical.
Map the 8-week spiral to your team
Paste the prompt into ChatGPT with one line about how your team currently measures AI usage. It will surface which week your org is closest to, what to expect next, and which signals to put in front of leadership first.
“|”
What deserves to be measured
The metrics not gameable by an agent are the same metrics that have always mattered. They look less impressive on a dashboard. They require someone to actually open the code.
- Shipped customer-visible changes per week. Not commits. Not PRs. Things a customer can use that they could not use before.
- Production incidents per shipped change. The cost of shipping fast with AI is shipping wrong with AI. If incidents grow faster than features, the AI is a net negative and someone needs to say it out loud.
- Time from problem identification to deployed fix. AI should compress this. If it is not compressing this, your team is using AI to generate motion, not to compress cycle time.
- Reviewer effort per PR. If reviewers spend more time on AI-assisted PRs than on human-written PRs of the same size, the assistant is shifting work, not eliminating it.
None of these can be pulled from a billing dashboard. All of them require a human to look at the codebase and the customer. That is the part nobody wants to hear. It is the only part that matters.
What this moment signals
The token leaderboard is funny. It is also a leading indicator.
Two years into AI-first development, the early-adopter dust is settling and businesses are asking the actual question. Where is the ROI. Uber's president said publicly this week that AI spending is harder to justify than expected. That sentence is going to be quoted in board meetings for the next twelve months.
The companies that come out of this period strongest are the ones that figured out, early, the difference between AI activity and AI output. The companies running token leaderboards will figure it out too. Later. At higher cost. After they have trained their best engineers to optimize for the wrong target.
If you have a token leaderboard up right now, take it down. If you do not have one but are tempted, do not. If you have to measure something AI-related to satisfy a CFO, measure cycle time and incident rate. Then walk into the meeting and explain why the activity metrics are not on the slide.
The agent is not the bottleneck. The agent never was the bottleneck.
The bottleneck is judgment. Judgment does not show up on a leaderboard.
Got a dashboard that looks green while the product stops shipping?
We run two-week metrics audits on engineering orgs running AI tooling. We rebuild measurement so it tells you the truth instead of telling you what you want to hear. Send your team size and one example of a dashboard you cannot trust.
Related reading
- We Don't Reject AI. We Use It Like Surgeons.: rules for using AI in production without vibe-coding.
- From Enrichlead to Moltbook: The Vibe-Coded Graveyard: public autopsies of four vibe-coded startups.
- Ten Vibe-Coded Apps, Same Seven Defects: the seven defects we find in every vibe-coded repo.
Enjoyed this article? Share it with others
Related Posts

Seven Defects We Check First in Any Vibe-Coded App (proposed; old title in the notes)
AI coding tools make the same mistakes because they get asked the same questions. Here are the seven defects we look for first in a vibe-coded app, from paywalls enforced in the browser to AI features with unguarded tools, and a check for each.
The Transfer Pattern: Five Ways an Agency Project Goes Quiet (proposed; old title in the notes)
The deadline slipped twice and the Slack went quiet. Stalled agency projects tend to stall the same way, and the signs show up months early. Here are the five patterns, a five-minute check, and what to do when three of them match.

You're Allowed to Fire Your Dev Team. Here Is the Email.
Founders keep paying agencies that stopped shipping because firing them feels harsh. They were paid and they didn't deliver. Here is the email to send, the four things to have ready first, and what to do the morning after.